
Subscribe
Get the latest news from SWEDA. Fill out the form below to sign up for our email newsletter.
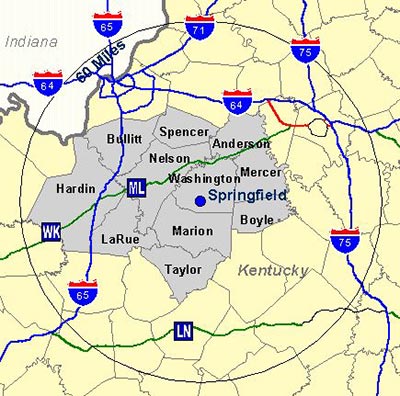
Labor market counties are composed of counties which significantly exist within the sixty (60) minute drive range of the originating county’s county seat. A county will be included within the radius if the centroid point of a county (a point representing the center of the geographic area of a county) falls within the drive zone. Additionally, all contiguous counties will be classified as part of the labor market with the exception of non-Kentucky contiguous counties which have been excluded by the above mentioned 60-minute drive range and have a border with the Mississippi and/or Ohio Rivers.
Civilian Labor Force
| Washington County | Labor Market Area | |||||
| 2017 | Nov. 2018 | 2017 | Nov. 2018 | |||
| Civilian Labor Force | 6,365 | 6,433 | 190,515 | 192,374 | ||
| Employed | 6,105 | 6,241 | 182,040 | 185,846 | ||
| Unemployed | 260 | 192 | 8,475 | 6,528 | ||
| Unemployment Rate (%) | 4.1 | 3.0 | 4.4 | 3.4 | ||
Source: U.S. Department of Labor, Bureau of Labor Statistics.
Unemployment Rate (%)
| Year | Washington County | Labor Market Area | Kentucky | U.S. | ||
| 2013 | 8.2 | 7.8 | 8.3 | 7.4 | ||
| 2014 | 5.5 | 6.2 | 6.5 | 6.2 | ||
| 2015 | 4.4 | 5.0 | 5.4 | 5.3 | ||
| 2016 | 4.1 | 4.4 | 5 | 4.9 | ||
| 2017 | 4.1 | 4.4 | 4.9 | 4.4 |
Source: U.S. Department of Labor, Bureau of Labor Statistics.
Commuting Patterns
| Residents of Washington County | 2015 | Percent | ||
| Working and Residing In County | 1,522 | 32.0 | ||
| Commuting Out of County | 3,237 | 68.0 | ||
| Total Residents | 4,759 | 100.0 | ||
| Employees in Washington County | ||||
| Working and Residing In County | 1,522 | 46.2 | ||
| Commuting Into County | 1,772 | 53.8 | ||
| Total Employees | 3,294 | 100.0 | ||
Source: U.S. Department of Labor, Bureau of Labor Statistics.
Average Weekly Wage, 2017
| Washington County | Kentucky (Statewide) | U.S. | |||
| Total All Industries | $665 | $845 | $1,042 | ||
| Total Private Industries | 752 | 865 | 1,064 | ||
| Natural Resources and Mining | 663 | 1,049 | 1,086 | ||
| Construction | 873 | 1,011 | 1,155 | ||
| Manufacturing | 944 | 1,108 | 1,272 | ||
| Trade, Transportation and Utilities | 608 | 789 | 881 | ||
| Information | 747 | 1,044 | 2,011 | ||
| Financial Activities | 1,061 | 1,236 | 1,752 | ||
| Professional and Business Services | 850 | 931 | 1,377 | ||
| Education and Health Services | 565 | 906 | 940 | ||
| Leisure and Hospitality | 223 | 327 | 441 | ||
| Other Services and Unclassified | 570 | 626 | 734 |
Source: JobsEQ, Chmura Economics.